
Telling stories about a product or service is one thing. But we can use lean design thinking to turn those anecdotes into real, actionable insight.
Have you ever been frustrated when your car won't start, by a delayed bus, or by a frantic search for your phone, wallet or keys before rushing out of the house?
We groan when unmet expectations like these disrupt our day.
To sidestep these issues, I've pretty much ditched a physical wallet and don't drive, turning instead to Google Pay and bike sharing instead.
On bike sharing in particular I also appreciate its contribution to:
- enhancing access in areas with limited public transport
- providing options for connecting and continuing public transport journeys
- promoting active health
- reducing motor vehicle use and air pollution
But bike sharing isn’t perfect. In fact, a recurring frustration with Lime bikes inspired me to write this blog post. By doing so I hope to accomplish two main goals:
- Demonstrate how a lean design thinking process can be used to uncover deeper insights about an anecdotal product experience.
- Inspire improvement in the eBike sharing experience.
There’s also a third mini goal: to improve how I use DALL-E to create storytelling illustrations, tied into Sparck’s recent learning and development quarter dedicated to AI.
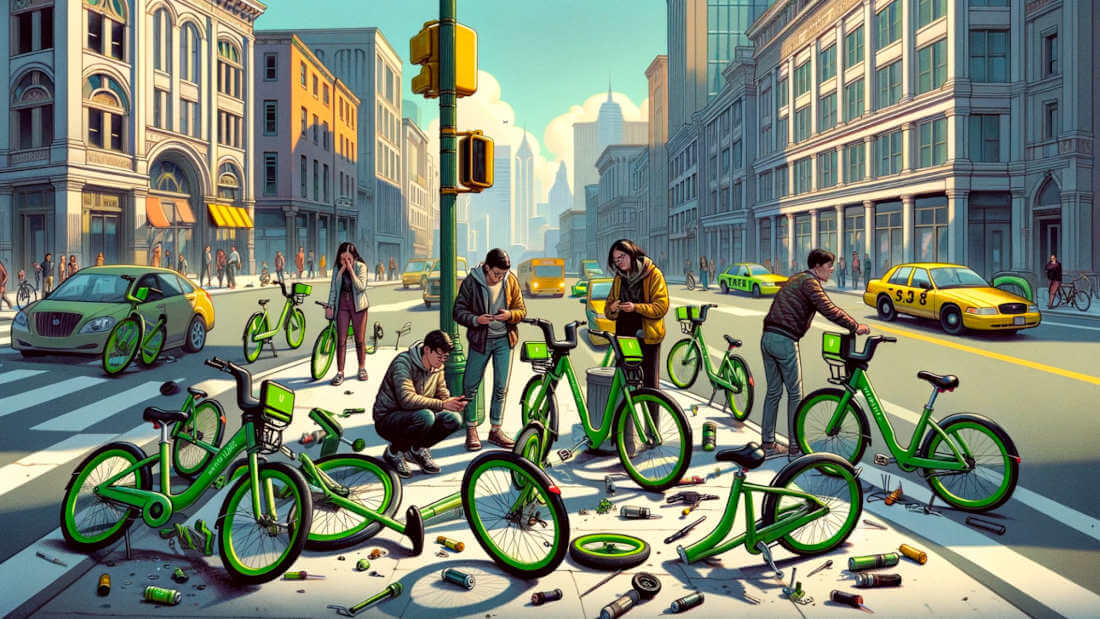
Most of the images in this post, like the one below, were created with DALL-E. They’re not perfect but they work for me, especially when it comes to visualising ideas.
Too-long, didn’t read (TL;DR)
The problem I’m addressing
Bad experiences caused by not knowing whether a bike will be in mechanically functional condition when you get to it.
This wastes users time and makes them reconsider using Lime for this trip at all, potentially leading to lost revenue.
This problem is exacerbated when a user locates and navigates to an isolated bike without other eBike options nearby.
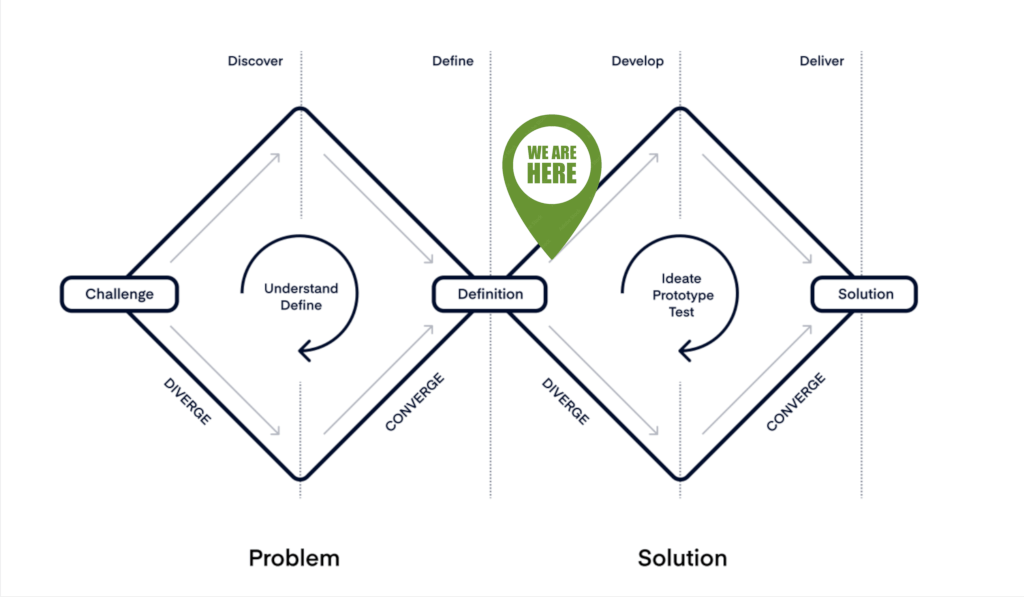
Steps I followed in this discovery
- Understand the customer: their journey, experiences and challenges.
- Define the right problem: why is it a worthy problem to solve and who does it affect?
- Raise a hypothesis: what I suspect solves the problem and its measurable impact.
- Identify assumptions: what risky assumptions have I made that need testing?
- Suggest solutions: if my assumptions are generally true, what could solutions look like?
Solutions worth exploring further
- Feedback-based system to identify bikes that are damaged.
- Predictive maintenance algorithm using user-generated feedback to prioritise repairs and reduce incidence of faulty bikes.
- Enhanced post-ride review interface to better pin down specific faults with bikes.
Predicted benefits
An increase in users' average daily trips and trip length, especially in scenarios where users navigate to isolated bikes with no other options in close proximity.
This will elevate the overall user experience and reinforce Lime's commitment to excellence in urban mobility.
About Lime and the bike share service they provide
Lime is a bike sharing service that provides a fleet of electric bikes, scooters, and mopeds that can be rented on-demand through a mobile app.
These vehicles are usually distributed throughout a city, providing an alternative to cars, public transportation, or walking for short-distance travel.
Their value is in their:
- convenience across multiple locations
- affordability compared to other travel options (especially if you buy ride passes)
- sustainability compared to carbon alternatives
- flexibility of use compared to transportation on fixed schedules
What is a typical Lime customer’s user journey?
For simplicity I focused on a particular scenario:
A returning Lime bicycle user who already has an account to borrow eBikes with saved payment details. They might have a Ride Pass or LimePrime membership that allows them to unlock bikes with no charge.
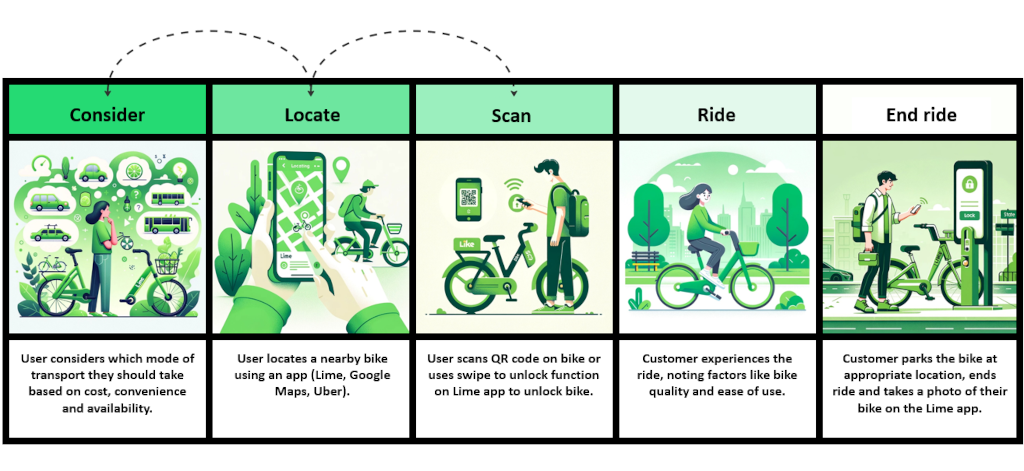
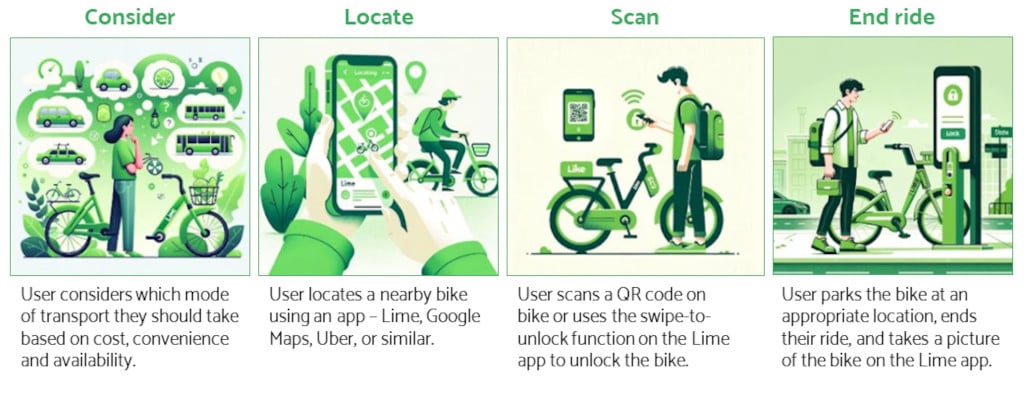
- Consider – the user considers which mode of transport they should take based on cost, convenience and availability.
- Locate – the user finds a nearby bike using an app (Lime, Google Maps, Uber).
- Scan – the user scans a QR code on the bike or uses the swipe to unlock function on Lime app to unlock bike.
- Ride – the customer experiences the ride, noting factors like bike quality and ease of use.
- End ride – they park the bike at an appropriate location, end the ride and take a photo of their bike on the Lime app.
- inspecting the bike for visible faults
- cleaning a wet seat
- switching apps to navigate to the final destination
I validated this through user research I conducted, which I’ll say more about later.
Lime’s mission and why I value their service
Lime’s mission statement is to “build a future where transportation is shared, affordable and carbon-free”.
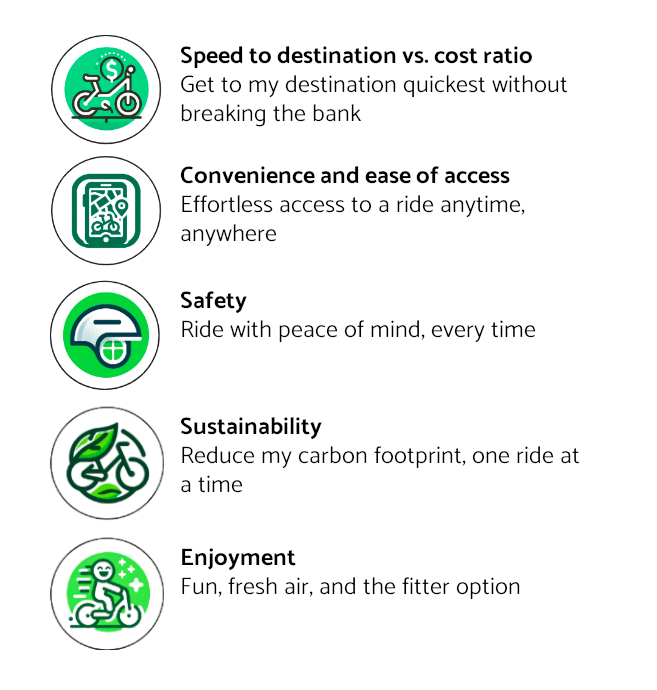
As an avid user myself I think they do a relatively good job at achieving this mission and cultivating an experience that delivers things I value.
So what frustrates me?
Since speed-to-destination/cost and safety are critical, anything that compromises these negatively impacts my experience. These two scenarios frustrate me the most:
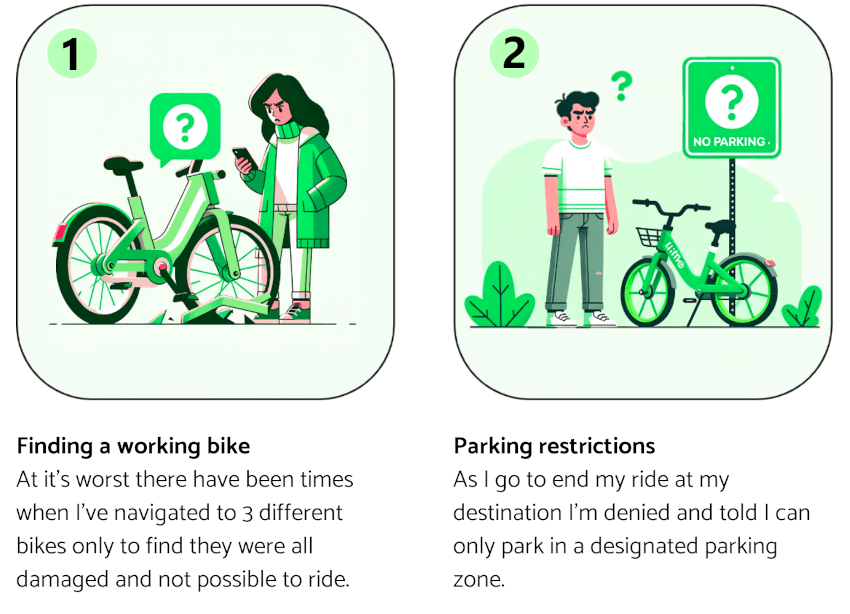
Both add extra time to my journey, either at the start or the end.
However, for scenario #2 I can appreciate the desire to centralise bikes because it:
- increases the chances of finding functioning bikes in known locations
- reduces clutters on sidewalks and prevents obstructions
The rest of this article will focus on exploring frustration #1 – how do we find a functioning bike to ride?
Researching the relevance and prevalence of personal frustration
Up until now my grievances are based on my own anecdotal experiences.
But maybe I'm just more sensitive to the problem than others?
Or maybe I'm just unlucky and it doesn't happen as often?
So, that prompts two specific questions:
- Do other people have this problem?
- And, if so, how often?
To dive deeper, I conducted interviews with 4 existing Lime customers to understand how they use Lime, and their experience with faulty bikes, if any.
About the 4 participants
The people I interviewed all had similar characteristics:
- male
- aged 25 to 35
- located in London in the UK
- taking up to 8 trips per month by Lime bike
I acknowledge that the limited diversity in my sample may affect the applicability of these findings to other user segments and use cases.
It would be great to repeat this research with a larger, more diverse group of participants.
My research question set
These were the research questions I asked participants broken down into 5 main buckets:
- When do you use Lime bikes? How many trips in a week or month When do you opt for alternative modes of transportation? Which and why?
- Walk me through your process from deciding to use Lime up to actually riding? How often are you using an app to navigate to a specific bike? How else are you locating bikes? (e.g. go to a central hub of bikes you know of)
- Have you encountered a faulty Lime bike you were intending to ride? How often does this occur? Describe the nature of the damage. What is the experience like? How does this make you feel?
- After encountering the faulty bike, what do you do? How do you solve the problem today? When you discover the bike is faulty before you ride it. When you discover the bike is faulty while riding it.
- What would be your ideal solution to any relevant frustrations you’ve mentioned?
A common theme: broken bikes are a waste of time
Here’s an excerpt from one of the participants that helpfully summarises and humanises the problem:
I can’t tell you the amount of times I’ve got to a bike only to realise it’s missing a pedal, a seat. What’s worse is when this happens when I’m already running late and went to this bike over another that could’ve been just fine. Also, what’s wrong with the bike might not be so obvious before I ride and just as I start to jet off I realise there's no pedal under my foot or my seat doesn’t stay up under my weight and I’m riding with my knees to my chest… I shouldn’t be so uncertain if I am going to get a reliable bike every time I navigate to one. Lime collects a wealth of data and user reviews on bikes. They should ensure the bikes I navigate to work every time.
Full research insights across the user journey
1. Consideration is influenced by various factors every trip.
That includes:
- weather conditions that impact the ride quality and enjoyability
- convenience and availability of other transport options
- fastest and cheapest route to destination
2. The likelihood of locating a faulty bike is impacted by search tactics and scenarios.
Tactics that decrease the likelihood include navigating to a larger pool of bikes to choose from. By heading to areas known to have several bikes like bike hubs you are more likely to find at least one bike in good working condition.
3. All riders feel some frustration or inconvenience when discovering that a bike is faulty.
This is especially true when you could have opted for other transport or a different bike in the first place, and have to spend more time looking for an alternative.
On average, participants navigated to a mechanically faulty bike they could not ride safely every fifth trip.
For individual research participants it ranged from between every third trip to every tenth.
4. Locating a mechanically faulty bike or riding one can lead to a bad customer experience.
Users in this scenario will find an alternative mode of transport, hunt for another Lime bike, ride the faulty bike anyway, or some combination of the above.
5. Not all users adequately inspect the bike for faults before riding.
This can lead to them having to abandon a ride and seek alternative transport. Lime doesn’t charge for very short rides which suggests it is aware of this problem.
6. Bike faults or damage can vary.
Some are easily visible, like a missing seat, while others only become apparent when you’re actually riding, such as the seat not staying in place. Ability to identify changes is also impacted by environmental conditions like inclement weather or level of sunlight available.
Some affect the ride quality more severely than others, such as wheels that will not turn so you can't steer.
7. Riders don’t always complete post-ride reviews.
This is both for positive or negative experiences on trips, including those involving a mechanically faulty bike that they cannot ride safely or properly.
Research defines the core problem
The central problem is the friction between:
- a user wanting a bike in mechanical condition to ride and
- uncertainty of the bike's condition until they have inspected it or are riding it
The target market likely impacted most by this problem
The issue of uncertain bike conditions primarily impacts users in two scenarios.
- Those who take extra time to navigate to a specific Lime bike they’ve located on an app.
- Those that scan out a Lime bike with a fault that was unaware to them.
Here’s an illustrative example of scenario 1 using a persona, Sarah, a 28-year-old graphic designer living in Brooklyn, New York City.
Every morning, Sarah follows a tight schedule to get to her office on the Lower East Side. She is reliant on Lime bikes for their convenience and often chooses them for her daily commute.
On a bright Tuesday morning, she is already running late. She has a client presentation at 9 am and it's already 8:15.
She grabs her bag and rushes out of her apartment whilst simultaneously checking her Lime app. There's a bike, just a five-minute walk away. Feeling relieved, she reserves it and hurries to the location.
As she turns the corner, she sees the Lime bike, isolated as the only one in sight.
Her relief turns to dismay when she discovers the bike is missing a pedal, making it no easier to ride than a unicycle (she never went to clown college).
With the only other Lime bike 8 minutes back the way she came, and time ticking away, Sarah's anxiety peaks. She now has to scramble to find an alternative, checking other transport apps or considering a hurried walk to the nearest subway station.
Her frustration is unmistakable. This isn't the first time she's faced this issue, but today it hits harder due to her important meeting.
As she hurries off in search of another option, she can't help but question the reliability of Lime bikes, especially during crucial times when any uncertainty elevates her anxiety.
A core hypothesis emerges
I believe a 5% growth in users' average daily trips and trip length could be achieved if they locate mechanically functional bikes, especially in scenarios where the bikes are isolated without others nearby.
This would be achieved through a collection of features and optimisations that better capture and use data to make users aware of potentially damaged bikes when they are trying to decide which bike to use.
It would also increase the speed with which those bikes are repaired.
And, of course, it would elevate the overall user experience as represented by NPS measures.
How in practice can we reduce any anxiety caused by uncertainty and ensure users more frequently find a functioning Lime bike, reducing their time spent searching and maximising their riding experience?
Assumptions that need validation
|
Assumption and relevance |
Related data/research required to validate |
|
Ridership after users locate or ride a faulty bike (faulty bike scenario) is lower. If false, this diminishes the commercial benefit for Lime to focus on this problem. |
|
|
We can reliably and accurately identify faulty bike scenarios using data. This is critical to solutions that are based on accurate tagging of faulty bikes and not ones in good condition. |
Two specific data indicators I’d like to explore further:
|
Assumptions already validated
|
Assumption |
How I validated this |
|
The uncertainty of not knowing the condition of a bike is anxiety inducing. |
A research article published in the journal Nature showed that it's less psychologically stressful to know something negative is about to happen (pizza delivery is running 5 minutes late) than to be left in uncertainty (we have no idea where your pizza is). |
|
Negative post-ride reviews or very short rides (under 1 minute) do not hide that bike from apps to prevent another user locating and navigating to a faulty bike. |
I’ve tested this multiple times after scanning out and ending rides and I was still able to locate and reserve that same bike again. |
|
Bike maintenance teams use post-ride review data to inform them of faulty bikes but I assume there are still opportunities to use data better to prioritise bikes with more severe faults first. |
I chatted with a Lime contractor shifting around bikes in London and he was kind enough to walk me through how he uses internal app tools to identify faulty bikes based on rider review data using an internal mobile app. Current and future aspects I’d want to validate further: a. Are full post-ride reviews (including info on the fault) necessary to flag bikes as faulty, or is a 1-star review sufficient? b. As some types of faults impair bike functionality and rider safety more than others, how can data be used to prioritise the order in which bikes are serviced? |
Brainstorming solutions for ideation and prototyping
An intelligent bike availability system
Instead of just showing the nearest bikes the user interface (UI) also displays a bikes ‘health status’ based on real-time customer reviews and geospatial data.
This visual nudge reduces the uncertainty of navigating to faulty bikes in the first place. It also make it less likely someone will pick up a bike with hard-to-spot faults.
A conservative approach to beta trial first could be using stricter data indicators before tagging a bike as faulty. For example, a bike needs to be reviewed 1-star by 2 different users back to back.
This could guard against dishonest or inaccurate reviews.
With enough confidence in the data another tweak to explore could be to hide faulty bikes from the UI altogether.
In brainstorming with a colleague we identified the major downfall with this approach to be confusion or friction caused when a user sees a bike in real life that isn’t available on the app. Why can’t I use that bike right there? Without good product communication this could be especially frustrating if the bike looked, at a glance, to be in good condition.
The expected outcome of this approach would be to reduce the instances of users wasting time navigating to faulty bikes, improving overall user satisfaction, as measured by increased total ridership.
An enhanced maintenance algorithm
Sequence bike repair pick-ups by optimising for bikes with severe ride quality issues. For instance, a bike with a missing seat is prioritised higher than one without a bell.
This could be balanced with other variables including frequency of use, historical repair data, and proximity from maintenance contractor.
This should reduce the downtime of bikes and increase their overall utilisation, as bikes are repaired and returned to service faster, ensuring a higher availability of functional bikes for riders.
An improved post-ride review interface
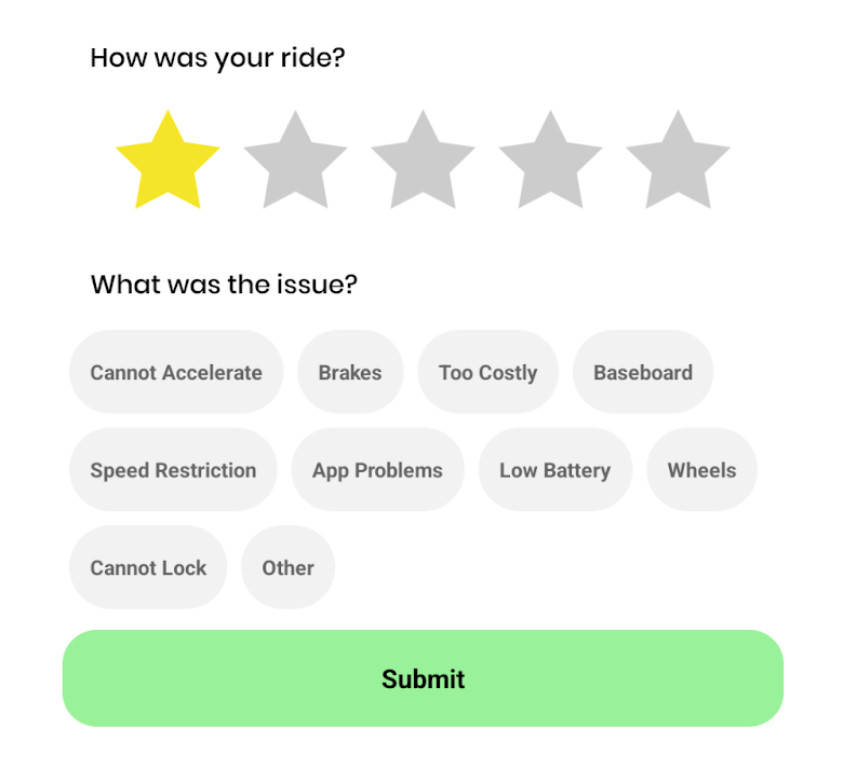
Enhance the current post-ride review interface (above) to include reporting specific issues like missing seats or pedals.
Combined with the two previous solutions this new feature would lead to more precise identification of bike faults.
A colleague who gave me input on this work also suggested that adding incentives might encourage riders to review more often and accurately. This is an interesting optimisation that warrants more exploration and experimentation. How would we make sure people didn’t abuse it?
Overall, this optimisation would lead to more accurate and specific identification of bike faults and support the benefits of the previous two solutions.
Let’s summarise the key steps thus far
- I had a hunch I wasn’t the only one frustrated when I located Lime’s mechanical faulty bikes.
- Through research interviews, I uncovered users experience nuances and defined a problem.
- I generated a hypothesis to validate and assumptions that are key to supporting it.
- I suggested solutions inspired by research and the problem to be solved to further explore.
So, what’s next?
If I was in the shoes of a product manager at Lime I’d combine these discovery insights with internal Lime data, further research, and institutional team expertise to:
- Ideate to uncover usable solutions: mature and iterate solutions with team and user feedback.
- Diminish value risk: validate assumptions to better understand if users will value the solutions.
- Diminish feasibility risk: work with engineering to reduce uncertainties on the ability to technically build the solutions (the best way to and how long it could take).
- Assess the viability: work with key stakeholders across the business to understand their specific constraints and considerations. Is the solution workable for the business, its vision, and its strategy? What does success look like and how are we measuring it?
Next, core version of features can be tested internally as part of an Alpha release before a more complete Beta version is released to a closed group of users.
The goal should be to get enough information through testing and feedback to make decisions confidently and quickly.
I acknowledge there are aspects my outlined approach doesn’t cover, such as go-to-market strategies, or what to do post-launch.
My goal isn’t to be exhaustive but to demonstrate how to apply a lean design thinking process to uncover the building blocks required to inspire truly innovative solutions.
Hopefully it will inspire you to reflect on your own experiences and anecdotes, equipping you with effective strategies and tools you can use to develop antidotes.